背景
参考
https://bpftrace.org/tutorial-one-liners
bpftrace 作为 eBPF 之上的脚本语言,灵感来自于 awk 和 c
编写 bpftrace 的效率比 开发 bpf 程序高很多,简单又方便
这篇文章包含了 bpftrace 的 12 个命令,可以作为学习 bpftrac 的基础
每个命令都是单行程序,简单明了
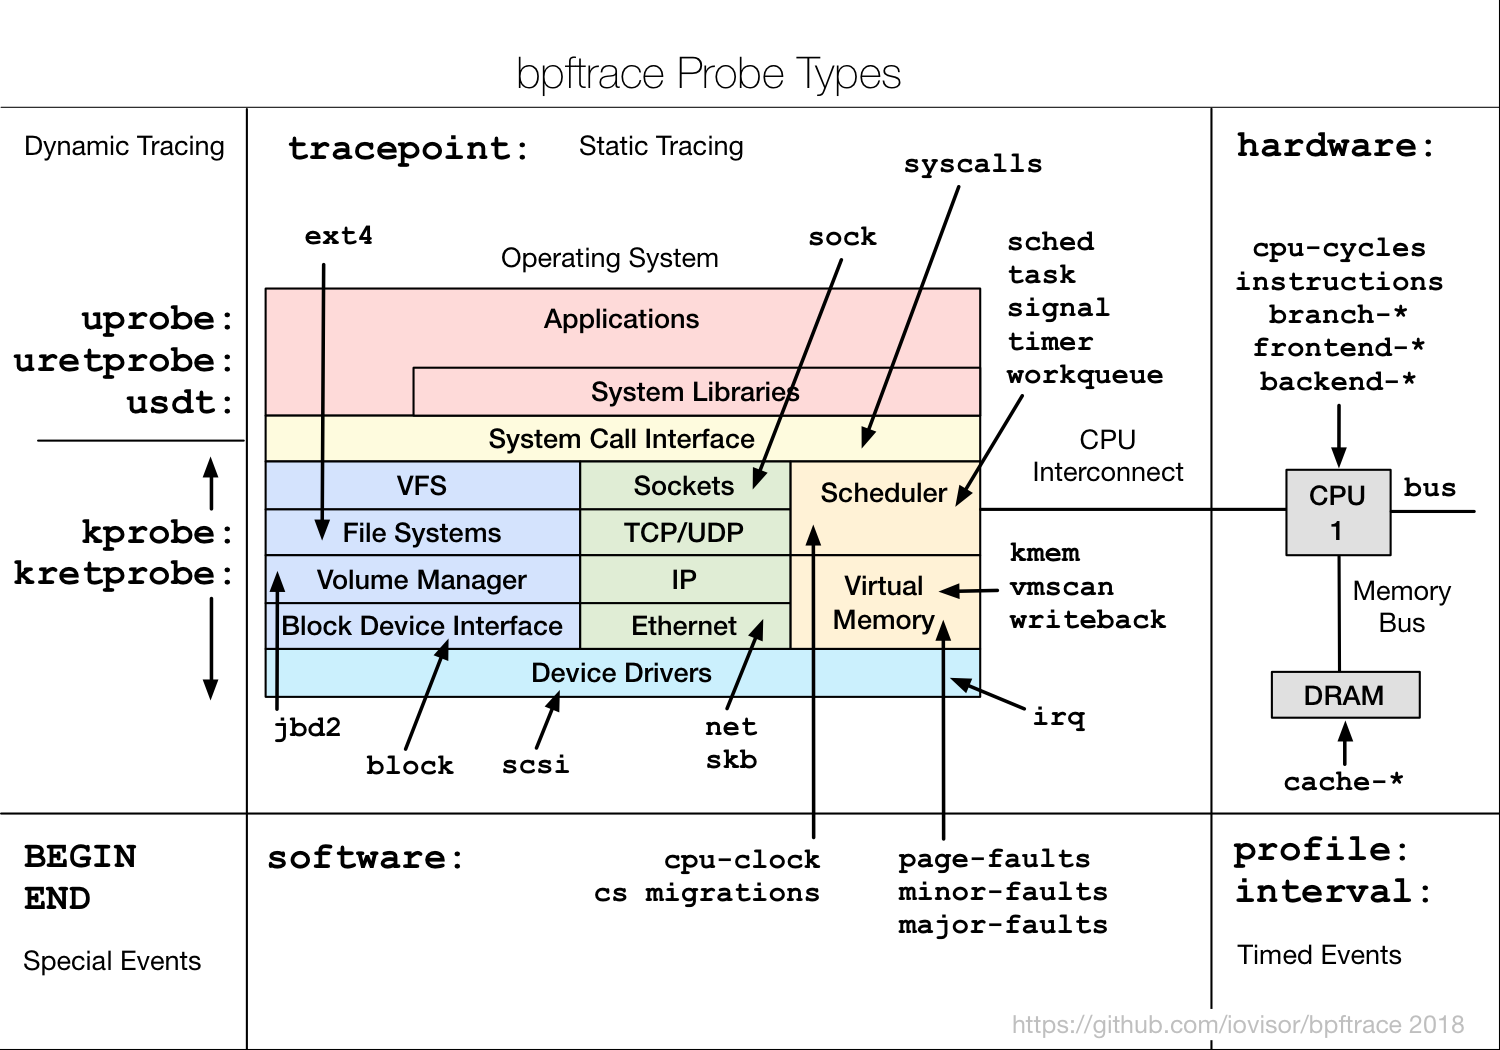
bpftrace 的各种 Probe 类型:
1. Listing Probes
命令
1
|
bpftrace -l 'tracepoint:syscalls:sys_enter_*'
|
打印结果:
 1
 2
 3
 4
 5
 6
 7
 8
 9
10
11
12
13
14
15
|
tracepoint:syscalls:sys_enter_accept
tracepoint:syscalls:sys_enter_accept4
tracepoint:syscalls:sys_enter_access
tracepoint:syscalls:sys_enter_acct
......
tracepoint:syscalls:sys_enter_open
tracepoint:syscalls:sys_enter_open_by_handle_at
tracepoint:syscalls:sys_enter_open_tree
tracepoint:syscalls:sys_enter_openat
tracepoint:syscalls:sys_enter_openat2
......
tracepoint:syscalls:sys_enter_wait4
tracepoint:syscalls:sys_enter_waitid
tracepoint:syscalls:sys_enter_write
tracepoint:syscalls:sys_enter_writev
|
解释
- bpftrace -l 是搜索命令,查看有哪些跟踪点
- tracepoint 就是一个 probe,可以被跟踪的:跟踪点
- 支持 *, ? 通配符
还可以加上-v,打印出更多的参数
1
|
bpftrace -lv 'tracepoint:syscalls:sys_enter_open'
|
结果:
1
2
3
4
5
|
tracepoint:syscalls:sys_enter_open
    int __syscall_nr
    const char * filename
    int flags
    umode_t mode
|
再测试一下
1
|
bpftrace -e 'tracepoint:syscalls:sys_enter_open { printf("pid->%d, filename->%s \n", pid, str(args->filename)); }'
|
结果:
 1
 2
 3
 4
 5
 6
 7
 8
 9
10
11
|
Attaching 1 probe...
pid->46975, filename->/kafka/kafka-logs-abc0cd3cf0b2/recovery-point-offset-checkpoint
pid->46975, filename->/kafka/kafka-logs-abc0cd3cf0b2/log-start-offset-checkpoint.tmp
pid->46975, filename->/kafka/kafka-logs-abc0cd3cf0b2/cleaner-offset-checkpoint
pid->21568, filename->/etc/hosts
pid->46718, filename->/usr/share/elasticsearch/config
pid->46718, filename->/usr/share/elasticsearch/config/jvm.options.d
pid->46718, filename->/usr/share/elasticsearch/config
pid->46718, filename->/usr/share/elasticsearch/config/jvm.options.d
pid->46718, filename->/usr/share/elasticsearch/config
pid->46718, filename->/usr/share/elasticsearch/config/jvm.options.d
|
2. Hello World
命令
1
|
bpftrace -e 'BEGIN { printf("hello world\n"); }'
|
BEGIN 是一个特殊的 probe,类似 awk 的 BEGIN
对应的是 END
比如 bpftrace 官网的 openscoop.bt 程序中:
 1
 2
 3
 4
 5
 6
 7
 8
 9
10
11
12
|
BEGIN
{
        printf("Tracing open syscalls... Hit Ctrl-C to end.\n");
        printf("%-6s %-16s %4s %3s %s\n", "PID", "COMM", "FD", "ERR", "PATH");
}

.....

END
{
        clear(@filename);
}
|
3. File Opens
命令
1
|
bpftrace -e 'tracepoint:syscalls:sys_enter_openat { printf("%s %s\n", comm, str(args->filename)); }'
|
打印结果:
1
2
3
4
5
6
7
8
9
|
Attaching 1 probe...
redis-server /proc/1/stat
redis-server /proc/1/stat
redis-server /proc/1/stat
redis-server /proc/1/stat
redis-server /proc/1/stat
redis-server /proc/1/stat
redis-server /proc/1/stat
redis-server /proc/1/stat
|
解释
- comm,是 btrace 内置的变量
- args->filename 用于打印文件名
- 主要要用 str() 做转换,str()也是内置函数
参数格式:
1
|
tracepoint:<subsystem>:<event>
|
解释
- tracepoint: 跟踪点类型
- syscalls: 子系统
- sys_enter_openat: 特定的事件
子系统类型非常多
1
|
bpftrace -l 'tracepoint:*:*' | awk -F: '{print $2}' | sort | uniq
|
结果:
  1
  2
  3
  4
  5
  6
  7
  8
  9
 10
 11
 12
 13
 14
 15
 16
 17
 18
 19
 20
 21
 22
 23
 24
 25
 26
 27
 28
 29
 30
 31
 32
 33
 34
 35
 36
 37
 38
 39
 40
 41
 42
 43
 44
 45
 46
 47
 48
 49
 50
 51
 52
 53
 54
 55
 56
 57
 58
 59
 60
 61
 62
 63
 64
 65
 66
 67
 68
 69
 70
 71
 72
 73
 74
 75
 76
 77
 78
 79
 80
 81
 82
 83
 84
 85
 86
 87
 88
 89
 90
 91
 92
 93
 94
 95
 96
 97
 98
 99
100
101
102
103
104
105
|
alarmtimer
amd_cpu
avc
block
bpf_test_run
bpf_trace
bridge
btrfs
cgroup
clk
compaction
cpuhp
cros_ec
dev
devfreq
devlink
dma_fence
drm
error_report
exceptions
ext4
fib
fib6
filelock
filemap
fs_dax
gpio
huge_memory
hwmon
hyperv
i2c
initcall
intel_iommu
interconnect
iocost
iomap
iommu
io_uring
irq
irq_matrix
irq_vectors
jbd2
kmem
libata
mce
mdio
migrate
mmap
mmap_lock
mmc
module
mptcp
msr
napi
neigh
net
netlink
nmi
oom
osnoise
page_isolation
pagemap
page_pool
percpu
power
printk
pwm
qdisc
ras
raw_syscalls
rcu
regmap
regulator
resctrl
rpm
rseq
rtc
sched
scsi
signal
skb
smbus
sock
spi
sunrpc
swiotlb
sync_trace
syscalls
task
tcp
thermal
thermal_power_allocator
timer
tlb
tls
udp
vmscan
vsyscall
wbt
workqueue
writeback
x86_fpu
xdp
xen
xhci-hcd
|
主要包括:
- Core System Subsystems
- Memory Management
- Storage & Filesystems
- Networking
- Security
- Virtualization
- Debugging & Tracing
4. Syscall Counts By Process
命令
1
|
bpftrace -e 'tracepoint:raw_syscalls:sys_enter { @num[comm] = count(); }'
|
打印:
 1
 2
 3
 4
 5
 6
 7
 8
 9
10
11
12
13
|
@[SessionTracker]: 2
@[mysql-cj-abando]: 2
@[in:imuxsock]: 3
@[in:imtcp]: 3
@[http-nio-8080-P]: 4
@[ConnnectionExpi]: 5
@[rs:main Q:Reg]: 6
@[tini]: 8
@[GC Thread#12]: 9
@[GC Thread#15]: 9
@[GC Thread#7]: 9
。。。。。。
。。。。。。
|
解释
- @num 是一个特殊的变量,可以跨多个事件共享,类似全局变量
- [], 类似一个map 的 key,关联数组
- count(),内置的函数,统计 key 被执行了多少次
类似的函数如下:
| Name |
Description |
Sync/async |
| avg |
Calculate the running average of n between consecutive calls. |
Sync |
| clear |
Clear all keys/values from a map. |
Async |
| count |
Count how often this function is called. |
Sync |
| delete |
Delete a single key from a map. |
Sync |
| has_key |
Return true (1) if the key exists in this map. Otherwise return false (0). |
Sync |
| hist |
Create a log2 histogram of n using buckets per power of 2, 0 <= k <= 5, defaults to 0. |
Sync |
| len |
Return the number of elements in a map. |
Sync |
| lhist |
Create a linear histogram of n. lhist creates M ((max - min) / step) buckets in the range [min,max) where each bucket is step in size. |
Sync |
| max |
Update the map with n if n is bigger than the current value held. |
Sync |
| min |
Update the map with n if n is smaller than the current value held. |
Sync |
| stats |
Combines the count, avg and sum calls into one. |
Sync |
| sum |
Calculate the sum of all n passed. |
Sync |
| zero |
Set all values for all keys to zero. |
Async |
5. Distribution of read() Bytes
命令
1
|
bpftrace -e 'tracepoint:syscalls:sys_exit_read /pid == 18644/ { @bytes = hist(args->ret); }'
|
结果:
 1
 2
 3
 4
 5
 6
 7
 8
 9
10
11
12
|
Attaching 1 probe...
^C

@bytes:
[0, 1]                12 |@@@@@@@@@@@@@@@@@@@@                                |
[2, 4)                18 |@@@@@@@@@@@@@@@@@@@@@@@@@@@@@@@                     |
[4, 8)                 0 |                                                    |
[8, 16)                0 |                                                    |
[16, 32)               0 |                                                    |
[32, 64)              30 |@@@@@@@@@@@@@@@@@@@@@@@@@@@@@@@@@@@@@@@@@@@@@@@@@@@@|
[64, 128)             19 |@@@@@@@@@@@@@@@@@@@@@@@@@@@@@@@@                    |
[128, 256)             1 |@
|
解释
- /pid == 18644/ ,表示只跟踪 18644 进程
- args->ret,是返回值,如果出错则返回 -1,否则返回读取了多少字节
- hist(),是按照 2 的幂,打印的柱状图
@num[comm] = count()
graph LR
    A[comm] -->|Key: Process name| B[Hash Map]
    B -->|Value| C[Counter]
    C -->|Increments| D[Per-key count]
    style A stroke:#3f3
    style C stroke:#09f
@bytes = hist(args->ret)
graph LR
    A[args.ret] -->|Input value| B[hist function]
    B -->|Bucket assignment| C[Histogram Map]
    C --> D[Logarithmic Buckets]
    style D stroke:#f90
6. Kernel Dynamic Tracing of read() Bytes
命令
1
|
bpftrace -e 'kretprobe:vfs_read { @bytes = lhist(retval, 0, 2000, 200); }'
|
打印结果:
 1
 2
 3
 4
 5
 6
 7
 8
 9
10
11
12
13
|
@bytes:
(..., 0)             269 |@@@@@@@@@@@@@@                                      |
[0, 200)             960 |@@@@@@@@@@@@@@@@@@@@@@@@@@@@@@@@@@@@@@@@@@@@@@@@@@@@|
[200, 400)           134 |@@@@@@@                                             |
[400, 600)            68 |@@@                                                 |
[600, 800)            58 |@@@                                                 |
[800, 1000)          108 |@@@@@                                               |
[1000, 1200)         416 |@@@@@@@@@@@@@@@@@@@@@@                              |
[1200, 1400)          36 |@                                                   |
[1400, 1600)           4 |                                                    |
[1600, 1800)           3 |                                                    |
[1800, 2000)           1 |                                                    |
[2000, ...)          276 |@@@@@@@@@@@@@@                                      |
|
解释
- lhist(),内置函数,是线性柱状图,根据 min、max、步长来打印
- kretprobe 这是内核的动态追踪点,跟 tracepoint不同,它是静态的
kretprobe
- 其功能非常强大
- bpftrace -l ‘kprobe:*’ | wc -l
- 打印出来有:55758 数量
- 这些都是可以跟踪的函数
- 但是这些可能不“稳定”,随着内核版本变化,函数名,参数都有可能变化
- 如果想要获取参数,智能查对应版本的内核源码
7. Timing read()s
命令
1
2
3
4
5
6
7
8
|
bpftrace -e '
kprobe:vfs_read {
  @start[tid] = nsecs;
}
kretprobe:vfs_read /@start[tid]/ {
  @ns[comm] = hist(nsecs - @start[tid]);
 delete(@start[tid]);
}'
|
打印结果:
 1
 2
 3
 4
 5
 6
 7
 8
 9
10
11
12
13
14
15
|
@ns[http-nio-8080-e]:
[2K, 4K)               2 |@@@@@@@@@@@@@@@@@@@@@@@@@@@@@@@@@@@@@@@@@@@@@@@@@@@@|
[4K, 8K)               0 |                                                    |
[8K, 16K)              1 |@@@@@@@@@@@@@@@@@@@@@@@@@@                          |

@ns[elasticsearch[b]:
[2K, 4K)               1 |@@@@@@@@@@@@@@@@@@@@@@@@@@@@@@@@@@@@@@@@@@@@@@@@@@@@|
[4K, 8K)               1 |@@@@@@@@@@@@@@@@@@@@@@@@@@@@@@@@@@@@@@@@@@@@@@@@@@@@|
[8K, 16K)              1 |@@@@@@@@@@@@@@@@@@@@@@@@@@@@@@@@@@@@@@@@@@@@@@@@@@@@|

@ns[cleanup]:
[4K, 8K)               3 |@@@@@@@@@@@@@@@@@@@@@@@@@@@@@@@@@@@@@@@@@@@@@@@@@@@@|

@ns[runc:[1:CHILD]]:
[64K, 128K)            4 |@@@@@@@@@@@@@@@@@@@@@@@@@@@@@@@@@@@@@@@@@@@@@@@@@@@@|
|
解释
- 当触发 vfs_read 时,将 @start[tid] 作为 key,
- 当退出 vfs_read时:kretprobe:vfs_read
- 条件:/@start[tid]/ 确保我们只处理具有记录的开始时间的操作
- 计算延迟: nsecs - @start[tid]
- @ns[comm] 按照 进程 name 做聚合
- delete(@start[tid]):删除临时的 timestamp
执行过程
sequenceDiagram
    participant Kprobe
    participant Kernel
    participant Kretprobe
    participant Map

    Note over Kernel: vfs_read called
    Kprobe->>Map: Record start time (nsecs) for TID
    Note over Kernel: File read operation executes
    Note over Kernel: vfs_read returns
    Kretprobe->>Map: Check if start time exists for TID
    Kretprobe->>Map: Calculate latency (now - start)
    Kretprobe->>Map: Store latency histogram by comm
    Kretprobe->>Map: Delete TID entry
8. Count Process-Level Events
命令
1
|
bpftrace -e 'tracepoint:sched:sched* { @[probe] = count(); } interval:s:5 { exit(); }'
|
打印结果:
 1
 2
 3
 4
 5
 6
 7
 8
 9
10
11
|
@[tracepoint:sched:sched_wakeup_new]: 1
@[tracepoint:sched:sched_process_fork]: 1
@[tracepoint:sched:sched_process_exec]: 1
@[tracepoint:sched:sched_process_exit]: 1
@[tracepoint:sched:sched_process_free]: 2
@[tracepoint:sched:sched_process_wait]: 7
@[tracepoint:sched:sched_wake_idle_without_ipi]: 53
@[tracepoint:sched:sched_stat_runtime]: 212
@[tracepoint:sched:sched_wakeup]: 253
@[tracepoint:sched:sched_waking]: 253
@[tracepoint:sched:sched_switch]: 510
|
解释
- 跟踪的是 sche 类型事件
- 比如 fork,exec,上下文切换等
- interval:s:5, 每 5秒触发一次
- exit(),表示退出,配合 interval 表示跟踪 5秒后退出
9. Profile On-CPU Kernel Stacks
命令
1
|
bpftrace -e 'profile:hz:99 { @[kstack] = count(); }'
|
打印:
 1
 2
 3
 4
 5
 6
 7
 8
 9
10
11
12
13
14
15
|
@[
    apparmor_file_alloc_security+101
    security_file_alloc+78
    __alloc_file+89
    alloc_empty_file+69
    path_openat+71
    do_filp_open+178
    do_sys_openat2+159
    __x64_sys_openat+85
    x64_sys_call+6741
    do_syscall_64+86
    entry_SYSCALL_64_after_hwframe+108
]: 1
......
......
|
解释
- profile:hz:99,cpu在 99 HZ 的时候触发
- 不是 100HZ 也不是 1000HZ,因为太高太低都不好,100足够了
- 因为 100可能会跟其他定时任务冲突,所以用 99
- kstack 打印内核堆栈
- @[kstack] 相当于 map 的key
也可以打印具体的 pid 和 comm
1
|
bpftrace -e 'profile:hz:999 { printf("pid->%d, comm->%s\n", pid, comm); }'
|
10. Scheduler Tracing
命令
1
|
bpftrace -e 'tracepoint:sched:sched_switch { @[kstack] = count(); }'
|
打印:
 1
 2
 3
 4
 5
 6
 7
 8
 9
10
11
12
13
14
15
16
17
18
19
20
21
|
@[
    __traceiter_sched_switch+63
    __traceiter_sched_switch+63
    __schedule+855
    __cond_resched+57
    mutex_lock+19
    unix_stream_read_generic+231
    unix_stream_recvmsg+140
    sock_recvmsg+120
    sock_read_iter+143
    new_sync_read+385
    vfs_read+262
    ksys_read+181
    __x64_sys_read+25
    x64_sys_call+7610
    do_syscall_64+86
    entry_SYSCALL_64_after_hwframe+108
]: 1

......
......
|
解释
- sched,用来跟踪内核中的各种 cpu 调度事件
- 比如:sched_switch, sched_wakeup, sched_migrate_task 等等
- sched_switch:当前线程离开cpu 时候触发,比如发生了阻塞,等待I/O,定时,paging/swapping,或者 lock
- kstack 是内置变量,打印内核堆栈,通过线程离开,可以打印出堆栈上下文信息
另一个命令:
 1
 2
 3
 4
 5
 6
 7
 8
 9
10
11
12
13
|
bpftrace -e 'tracepoint:sched:sched_process_exec {
   printf("filename -> %s, pid -> %d\n", str(args->filename), args->pid);
}'

Attaching 1 probe...
filename -> /usr/bin/mysqladmin, pid -> 25650
filename -> /usr/bin/runc, pid -> 25656
filename -> /proc/self/exe, pid -> 25663
filename -> /dev/fd/5, pid -> 25663
filename -> /usr/sbin/dumpe2fs, pid -> 25665
filename -> /usr/sbin/dumpe2fs, pid -> 25673
filename -> /bin/sh, pid -> 25667
filename -> /usr/bin/nc, pid -> 25674
|
所有的 sched 事件:
 1
 2
 3
 4
 5
 6
 7
 8
 9
10
11
12
13
14
15
16
17
18
19
20
21
22
23
24
25
26
27
28
29
|
bpftrace -l 'tracepoint:sched:*'

tracepoint:sched:sched_kthread_stop
tracepoint:sched:sched_kthread_stop_ret
tracepoint:sched:sched_kthread_work_execute_end
tracepoint:sched:sched_kthread_work_execute_start
tracepoint:sched:sched_kthread_work_queue_work
tracepoint:sched:sched_migrate_task
tracepoint:sched:sched_move_numa
tracepoint:sched:sched_pi_setprio
tracepoint:sched:sched_process_exec
tracepoint:sched:sched_process_exit
tracepoint:sched:sched_process_fork
tracepoint:sched:sched_process_free
tracepoint:sched:sched_process_hang
tracepoint:sched:sched_process_wait
tracepoint:sched:sched_stat_blocked
tracepoint:sched:sched_stat_iowait
tracepoint:sched:sched_stat_runtime
tracepoint:sched:sched_stat_sleep
tracepoint:sched:sched_stat_wait
tracepoint:sched:sched_stick_numa
tracepoint:sched:sched_swap_numa
tracepoint:sched:sched_switch
tracepoint:sched:sched_wait_task
tracepoint:sched:sched_wake_idle_without_ipi
tracepoint:sched:sched_wakeup
tracepoint:sched:sched_wakeup_new
tracepoint:sched:sched_waking
|
11. Block I/O Tracing
命令
1
|
bpftrace -e 'tracepoint:block:block_rq_issue { @res = hist(args->bytes); }'
|
打印:
 1
 2
 3
 4
 5
 6
 7
 8
 9
10
11
12
13
14
15
16
17
18
19
|
@res:
[0]                   21 |@@@@@@@@@@@@@@@@@                                   |
[1]                    0 |                                                    |
[2, 4)                 0 |                                                    |
[4, 8)                 0 |                                                    |
[8, 16)                1 |                                                    |
[16, 32)               0 |                                                    |
[32, 64)               0 |                                                    |
[64, 128)              0 |                                                    |
[128, 256)             0 |                                                    |
[256, 512)             0 |                                                    |
[512, 1K)              0 |                                                    |
[1K, 2K)               0 |                                                    |
[2K, 4K)               0 |                                                    |
[4K, 8K)              64 |@@@@@@@@@@@@@@@@@@@@@@@@@@@@@@@@@@@@@@@@@@@@@@@@@@@@|
[8K, 16K)             11 |@@@@@@@@                                            |
[16K, 32K)             2 |@                                                   |
[32K, 64K)             5 |@@@@                                                |
[64K, 128K)            5 |@@@@                                                |
|
解释
- tracepoint:block,用来跟踪各种 存储类的事件
- block_rq_issue,当向设备发出 I/O 时触发
- args.bytes,发送的字节数量
- hist,以 2次幂,打印直方图
完整参数
 1
 2
 3
 4
 5
 6
 7
 8
 9
10
|
bpftrace -lv 'tracepoint:block:block_rq_issue'

tracepoint:block:block_rq_issue
    dev_t dev
    sector_t sector
    unsigned int nr_sector
    unsigned int bytes
    char rwbs[8]
    char comm[16]
    __data_loc char[] cmd
|
所有 block 相关的事件:
 1
 2
 3
 4
 5
 6
 7
 8
 9
10
11
12
13
14
15
16
17
18
19
|
bpftrace -l 'tracepoint:block:*'
tracepoint:block:block_bio_backmerge
tracepoint:block:block_bio_bounce
tracepoint:block:block_bio_complete
tracepoint:block:block_bio_frontmerge
tracepoint:block:block_bio_queue
tracepoint:block:block_bio_remap
tracepoint:block:block_dirty_buffer
tracepoint:block:block_getrq
tracepoint:block:block_plug
tracepoint:block:block_rq_complete
tracepoint:block:block_rq_insert
tracepoint:block:block_rq_issue
tracepoint:block:block_rq_merge
tracepoint:block:block_rq_remap
tracepoint:block:block_rq_requeue
tracepoint:block:block_split
tracepoint:block:block_touch_buffer
tracepoint:block:block_unplug
|
12. Kernel Struct Tracing
命令
 1
 2
 3
 4
 5
 6
 7
 8
 9
10
|
cat path.bt
#ifndef BPFTRACE_HAVE_BTF
#include <linux/path.h>
#include <linux/dcache.h>
#endif

kprobe:vfs_open
{
	printf("open path: %s\n", str(((struct path *)arg0)->dentry->d_name.name));
}
|
打印结果:
1
2
3
4
5
6
7
|
bpftrace path.bt

Attaching 1 probe...
open path: dev
open path: if_inet6
open path: retrans_time_ms
[...]
|
解释
- arg0 是内置的变量表示第一个参数,以此类推arg1, arg2…
- ((struct path *)arg0)->dentry->d_name.name
- 将第一个参数 cast 成:struct path * 类型,再解引用:dentry
- 因为 引用了内核的结构体,所以这里需要加入 #include
trace: vfs_read
 1
 2
 3
 4
 5
 6
 7
 8
 9
10
11
12
13
|
#ifndef BPFTRACE_HAVE_BTF
#include <linux/path.h>
#include <linux/fs.h>
#include <linux/dcache.h>
#endif

kprobe:vfs_read /pid == 46711/
{
    $file = (struct file*)arg0;
    $path = $file->f_path;
    $name_ptr = $path.dentry->d_name.name;
    printf("open path: %s\n", str($name_ptr));
}
|
参考