背景
调试信息
跟内核态类似,跟踪用户态程序时
也需要知道,这个进程对应的 二进制文件中,提供了哪些可用的跟踪单
类似 GDB 中的二进制调试信息
DWARF:Debugging With Attributed Record Formats
- Linux 和类 Unix 平台最主流的调试信息格式
- 格式存储到了编译后的二进制文件中
- 跨指令集、操作系统、编译器,独立的 调试符号信息
- 参考连接:DWARF
DWARF 例子
1
2
|
g++ --std=c++20 -g -o aa aa.c
|
打印结果
 1
 2
 3
 4
 5
 6
 7
 8
 9
10
11
12
13
14
15
16
17
18
19
20
21
22
23
24
25
26
27
28
29
30
31
32
33
34
35
36
37
38
39
40
41
42
43
44
45
46
47
48
49
50
51
52
53
54
55
56
57
58
59
60
61
62
63
64
65
66
67
68
69
70
71
72
73
74
75
76
77
78
79
80
81
|
dwarfdump aa

.debug_info

COMPILE_UNIT<header overall offset = 0x00000000>:
< 0><0x0000000c>  DW_TAG_compile_unit
                    DW_AT_producer              GNU C++20 13.3.0 -mtune=generic -march=x86-64
					-g -std=c++20 -fasynchronous-unwind-tables -fstack-protector-strong
					-fstack-clash-protection -fcf-protection
                    DW_AT_language              DW_LANG_C_plus_plus_14
                    DW_AT_name                  aa.c
                    DW_AT_comp_dir              /data/test/gcc
                    DW_AT_low_pc                0x00001129
                    DW_AT_high_pc               <offset-from-lowpc> 20 <highpc: 0x0000113d>
                    DW_AT_stmt_list             0x00000000

LOCAL_SYMBOLS:
< 1><0x0000002e>    DW_TAG_subprogram
                      DW_AT_external              yes(1)
                      DW_AT_name                  main
                      DW_AT_decl_file             0x00000001 /data/test/gcc/aa.c
                      DW_AT_decl_line             0x00000001
                      DW_AT_decl_column           0x00000005
                      DW_AT_type                  <0x0000005e>
                      DW_AT_low_pc                0x00001129
                      DW_AT_high_pc               <offset-from-lowpc> 20 <highpc: 0x0000113d>
                      DW_AT_frame_base            len 0x0001: 0x9c:
                          DW_OP_call_frame_cfa
                      DW_AT_call_all_calls        yes(1)
                      DW_AT_sibling               <0x0000005e>
< 2><0x00000050>      DW_TAG_variable
                        DW_AT_name                  x
                        DW_AT_decl_file             0x00000001 /data/test/gcc/aa.c
                        DW_AT_decl_line             0x00000002
                        DW_AT_decl_column           0x00000009
                        DW_AT_type                  <0x0000005e>
                        DW_AT_location              len 0x0002: 0x916c:
                            DW_OP_fbreg -20
< 1><0x0000005e>    DW_TAG_base_type
                      DW_AT_byte_size             0x00000004
                      DW_AT_encoding              DW_ATE_signed
                      DW_AT_name                  int

.debug_line: line number info for a single cu
Source lines (from CU-DIE at .debug_info offset 0x0000000c):

            NS new statement, BB new basic block, ET end of text sequence
            PE prologue end, EB epilogue begin
            IS=val ISA number, DI=val discriminator value
<pc>        [lno,col] NS BB ET PE EB IS= DI= uri: "filepath"
0x00001129  [   1,12] NS uri: "/data/test/gcc/aa.c"
0x00001131  [   2, 9] NS
0x00001138  [   3,12] NS
0x0000113b  [   4, 1] NS
0x0000113d  [   4, 1] NS ET

.debug_str
name at offset 0x00000000, length  154 is 'GNU C++20 13.3.0 -mtune=generic -march=x86-64
-g -std=c++20 -fasynchronous-unwind-tables -fstack-protector-strong -fstack-clash-protection
 -fcf-protection'
name at offset 0x0000009b, length    4 is 'main'

.debug_aranges

COMPILE_UNIT<header overall offset = 0x00000000>:
< 0><0x0000000c>  DW_TAG_compile_unit
                    DW_AT_producer              GNU C++20 13.3.0 -mtune=generic -march=x86-64
					-g -std=c++20 -fasynchronous-unwind-tables -fstack-protector-strong
					-fstack-clash-protection -fcf-protection
                    DW_AT_language              DW_LANG_C_plus_plus_14
                    DW_AT_name                  aa.c
                    DW_AT_comp_dir              /data/test/gcc
                    DW_AT_low_pc                0x00001129
                    DW_AT_high_pc               <offset-from-lowpc> 20 <highpc: 0x0000113d>
                    DW_AT_stmt_list             0x00000000


arange starts at 0x00001129, length of 0x00000014, cu_die_offset = 0x0000000c
arange end

.debug_frame is not present
|
一些简单的解释
1
2
3
4
5
6
7
8
9
|
<1><0x0000002e>      // Level 1, offset 0x2e
DW_TAG_typedef        // Type definition
DW_AT_name            // Attribute: name
size_t                // Value: defined as "size_t"
DW_AT_decl_file       // Declaration file
0x00000003/usr/lib/gcc/x86_64-linux-gnu/13/include/stddef.h // File path
DW_AT_decl_line 0x0000000d  // Line 13 (0xd in hex)
DW_AT_decl_column 0x00000017 // Column 23 (0x17 hex)
DW_AT_type <0x0000003a> // Points to underlying type at offset 0x3a
|
调试信息的查看工具
调试信息
- 调试信息并非一定要内置于最终分发的应用程序二进制文件中
- 它们也可以放到独立的调试文件存储。为了减少应用程序二进制文件的大小
- 通常会把调试信息从二进制文件中剥离出来
- 保存到 <应用名>.debuginfo 或者 .debug 文件中
- 后续排查问题需要用到时再安装
readelf -Ws 解释
- Purpose: Inspects the symbol table of an ELF binary/library. Symbols are names of functions/variables used for linking and debugging.
- Value: Memory offset of the symbol
- Size: Size of the symbol (e.g., function code size)
- Type: FUNC (function), OBJECT (variable), etc.
- Bind: GLOBAL (exported symbol), LOCAL (internal)
- Name: Symbol name + versioning (e.g., malloc@GLIBC_2.2.5)
1
2
3
4
5
6
|
# 查询符号表(RHEL8系统中 替换为/usr/lib64/libc.so.6)
readelf -Ws /usr/lib/x86_64-linux-gnu/libc.so.6

readelf -Ws /usr/lib64/libc.so.6 | grep -E 'malloc|free|calloc

readelf -Ws /usr/lib64/libc.so.6 | grep pthread_create
|
readelf -n
- Purpose: Inspects notes sections in ELF files, where User Statically Defined Tracing (USDT) probes are stored. USDT probes are debug hooks inserted during compilation.
- Provider: Library name (e.g., libc)
- Name: Probe identifier (e.g., memory_malloc)
- Location: Address offset in the binary
- Arguments: How to access probe arguments (register/memory offsets)
 1
 2
 3
 4
 5
 6
 7
 8
 9
10
11
12
13
14
15
16
17
18
|
# 查询USDT信息(USDT信息位于ELF文件的notes段)
readelf -n /usr/lib/x86_64-linux-gnu/libc.so.6

  stapsdt              0x0000004c       NT_STAPSDT (SystemTap probe descriptors)
    Provider: libc
    Name: memory_mallopt_arena_max
    Location: 0x00000000000a8f57, Base: 0x00000000001d6720, Semaphore: 0x0000000000000000
    Arguments: 8@%rax 8@32+mp_(%rip)
  stapsdt              0x0000004d       NT_STAPSDT (SystemTap probe descriptors)
    Provider: libc
    Name: memory_mallopt_arena_test
    Location: 0x00000000000a8f67, Base: 0x00000000001d6720, Semaphore: 0x0000000000000000
    Arguments: 8@%rax 8@24+mp_(%rip)
  stapsdt              0x00000054       NT_STAPSDT (SystemTap probe descriptors)
    Provider: libc
    Name: memory_tunable_tcache_max_bytes
    Location: 0x00000000000a8f80, Base: 0x00000000001d6720, Semaphore: 0x0000000000000000
    Arguments: 8@%rax 8@112+mp_(%rip)
|
查找
1
2
3
|
bpftrace -l 'uprobe:/usr/lib/x86_64-linux-gnu/libc.so.6:*' | grep fork

bpftrace -l 'usdt:/usr/lib/x86_64-linux-gnu/libc.so.6:*' | grep fork
|
例子
一个例子
1
|
bpftrace -e 'uprobe:/usr/lib/x86_64-linux-gnu/libc.so.6:malloc { @[comm] = count(); }'
|
打印结果
1
2
3
4
5
|
@[bpftrace]: 3
@[gsd-power]: 6
。。。
@[sshd]: 27588
@[bash]: 149148
|
另一个例子
uprobe:
1
2
3
4
5
6
7
8
|
# Terminal 1: Trace __libc_fork
sudo bpftrace -e \
'uprobe:/usr/lib/x86_64-linux-gnu/libc.so.6:__libc_fork {
    printf("[%d] %s called __libc_fork\n", pid, comm);
}'

# Terminal 2: Trigger fork
sleep 1 &  # Creates background process
|
usdt:
1
2
3
4
5
|
bpftrace -e ' \
usdt:/usr/lib/x86_64-linux-gnu/libc.so.6:libc:memory_* {
    printf("PID %d allocated %d bytes\n", pid, arg0);
    @allocations[comm] = count();
}'
|
USDT (User Statically Defined Tracing)
- allows developers to embed custom tracepoints directly into their applications or libraries. These tracepoints serve as stable,
- well-defined hooks that BPF programs can attach to for debugging and monitoring.
类似于这样的
1
2
3
4
5
6
7
8
9
|
// Compiled into binary: Probes become part of the ELF file (.note.stapsdt section).
// BPF attaches dynamically: No need to modify running binaries.
#include <sys/sdt.h> // USDT header
void process_payment(Payment *p) {
DTRACE_PROBE3(myapp, payment_start, // ← USDT probe
p->id, p->amount, p->currency);
// ... processing logic ...
}
|
伪代码:
 1
 2
 3
 4
 5
 6
 7
 8
 9
10
11
12
13
14
15
16
17
18
19
20
21
22
|
readelf -n /opt/myapp/bin/server | grep -A4 'stapsdt'

// 输出
Provider: myapp
Name: payment_start
Location: 0x4015a0
Arguments: -8@%rdi -4@%rsi -8@%rdx  # arg1=id, arg2=amount, arg3=currency


// BPF 程序
// Attach to USDT probe
SEC("usdt:/opt/myapp/bin/server:myapp:payment_start")
int trace_payment(struct pt_regs *ctx) {
    u64 id = BPF_CORE_READ(ctx, di);      // Read arg1 (rdi)
    u32 amount = BPF_CORE_READ(ctx, si);   // Read arg2 (rsi)
    char currency[8];
    bpf_probe_read_user_str(currency, sizeof(currency),
                            (void*)BPF_CORE_READ(ctx, dx)); // arg3 (rdx)

    bpf_printk("Payment %llu: %d %s", id, amount, currency);
    return 0;
}
|
编程语言对 BPF的影响,大致分为三类
- C、C++、Golang 等编译为机器码后再执行的编译型语言。这类编程语言开发的程序,通常会编译成 ELF 格式的二进制文件,包含了保存在寄存器或栈中的函数参数和返回值,因而可以直接通过二进制文件中的符号进行跟踪
- Python、Bash、Ruby 等通过解释器语法分析之后再执行的解释型语言。这类编程语言开发的程序,无法直接从语言运行时的二进制文件中获取应用程序的调试信息,通常需要跟踪解释器的函数,再从其参数中获取应用程序的运行细节
- Java、.Net、JavaScript 等先编译为字节码,再由即时编译器(JIT)编译为机器码执行的即时编译型语言。同解释型语言类似,这类编程语言无法直接从语言运行时的二进制文件中获取应用程序的调试信息。跟踪 JIT 编程语言开发的程序是最困难的,因为 JIT 编译的状态只存在于内存中
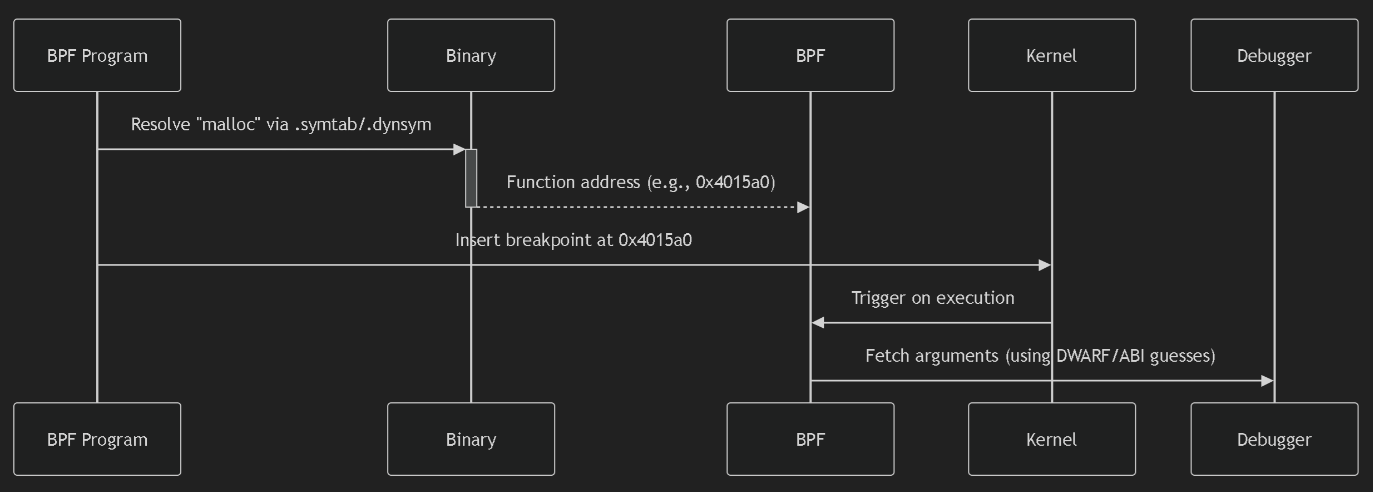
uprobe (User-Level Probe)
- Mechanism:
- Dynamic instrumentation of any function/symbol in user-space binaries/libraries.
- Pros:
- No code changes: Works on unmodified binaries.
- Flexible: Trace any function (public/private).
- Cons:
- Fragile: Breaks if function names/signatures change (e.g., library updates).
- Argument access: Hard to infer argument locations (requires debugging symbols or guesswork).
- Use Case:
- Quick debugging of third-party apps where you can’t modify source code.
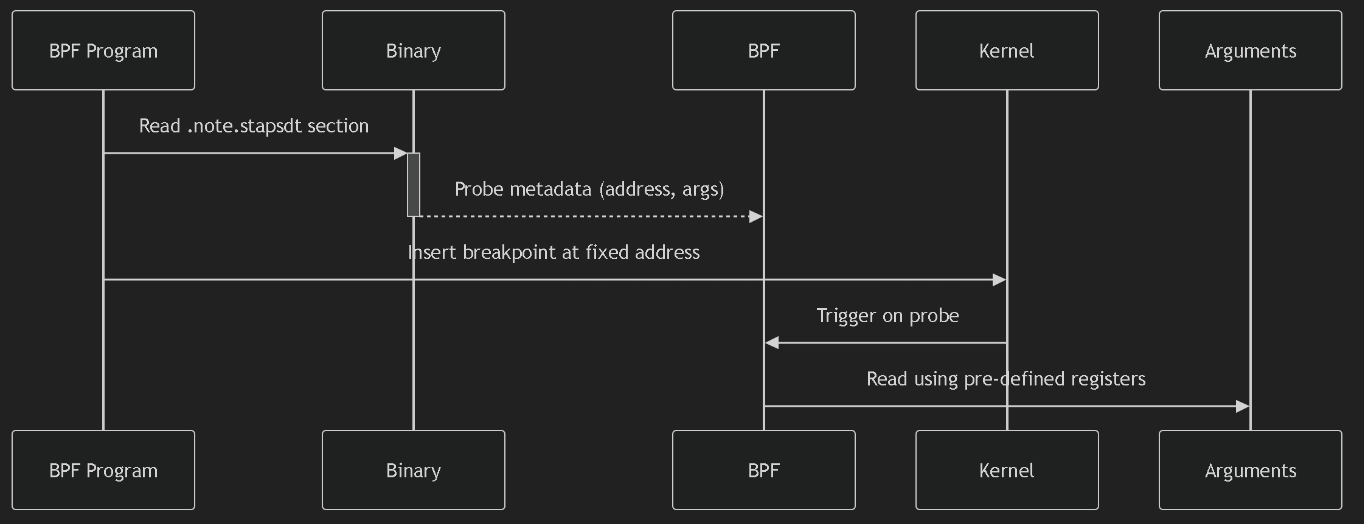
USDT (User Statically Defined Tracing)
- Mechanism:
- Developer-defined tracepoints compiled into the binary.
- Pros:
- Stable interface: Probe names/arguments survive binary updates.
- Rich context: Arguments are explicitly defined (types/registers).
- Low overhead: Optimized for production tracing.
- Cons:
- Requires code changes: Must modify source to add probes.
- Use Case:
- Production monitoring of custom apps (e.g., tracing business logic in databases).
Key Differences
| Feature |
uprobe |
USDT |
| Source Code Changes |
Not required |
Required |
| Stability |
❌ Breaks on symbol changes |
✅ Stable ABI |
| Argument Access |
❌ Hard (needs DWARF/guesswork) |
✅ Explicit (metadata in ELF) |
| Overhead |
Higher (symbol lookup) |
Lower (direct hook) |
| Target Functions |
Any function |
Only developer-defined points |
| Binary Requirements |
Debug symbols help (not required) |
.note.stapsdt section |
bpftrace 跟踪
1
2
3
4
5
6
7
8
|
bpftrace -e \
'uprobe:/lib/x86_64-linux-gnu/libc.so.6:malloc {
    printf("malloc(%d)\n", arg0);
}'

bpftrace -e 'usdt:/lib/x86_64-linux-gnu/libc.so.6:memory_malloc_retry {
    printf("malloc(%d)\n", arg0);
}'
|
uprobe Workflow
USDT Workflow
Core Probe Types
| Probe Type |
Description |
Syntax |
Unique Feature |
uprobe |
Trace entry to user-space functions |
uprobe:/path:function |
Trace function calls |
uretprobe |
Trace return from user-space functions |
uretprobe:/path:function |
Access retval |
usdt |
User Statically Defined Tracepoints |
usdt:/path:provider:probe |
Stable arguments |
kprobe |
Trace entry to kernel functions |
kprobe:function_name |
Kernel internals |
kretprobe |
Trace return from kernel functions |
kretprobe:function_name |
Kernel return values |
tracepoint |
Trace stable kernel tracepoints |
tracepoint:subsys:event |
Version-safe |
Specialized Probe Types
| Type |
Use Case |
Example |
profile |
Time-based sampling |
profile:hz:99 { @[kstack] = count() } |
interval |
Periodic reporting |
interval:s:5 { print(@events) } |
software: |
Count software events |
software:faults:1 { @page_faults++ } |
hardware: |
CPU performance counters |
hardware:cache-misses:1000000 { ... } |
BEGIN |
Initialize BPF state |
BEGIN { @start = nsecs } |
END |
Cleanup/reporting |
END { print(@counts) } |
iter |
Iterate kernel objects |
iter:task { printf("%s\n", task->comm) } |
编译型语言
查找
1
|
bpftrace -l 'uprobe:/usr/bin/bash:*' | grep read | grep line
|
跟踪 bash 程序
1
2
3
4
|
sudo bpftrace -e \
'uretprobe:/usr/bin/bash:readline {
  printf("User %d executed \"%s\" command\n", uid, str(retval));
}'
|
解释
- uretprobe:/usr/bin/bash:readline 设置跟踪类型为 uretprobe,跟踪的二进制文件为 /usr/bin/bash,跟踪符号为 readline
- 中括号里的内容为 uretprobe 的处理函数
- 处理函数中,uid 和 retval 是两个内置变量,分别表示用户 UID 以及返回值
- str 用于从指针中读取字符串, str(retval) 就是 Bash 中输入命令的字符串
- printf 用于向终端中打印一个字符串。
开发 BCC 程序
bashreadline.c 代码
 1
 2
 3
 4
 5
 6
 7
 8
 9
10
11
12
13
14
15
16
17
18
19
20
21
22
23
24
|
// 包含头文件
#include <uapi/linux/ptrace.h>

// 定义数据结构和性能事件映射
struct data_t {
    u32 uid;
    char command[64];
};
BPF_PERF_OUTPUT(events);

// 定义uretprobe处理函数
int bash_readline(struct pt_regs *ctx)
{
    // 查询uid
    struct data_t data = { };
    data.uid = bpf_get_current_uid_gid();

    // 从PT_REGS_RC(ctx)读取返回值
    bpf_probe_read_user(&data.command, sizeof(data.command), (void *)PT_REGS_RC(ctx));

    // 提交性能事件
    events.perf_submit(ctx, &data, sizeof(data));
    return 0;
}
|
python 代码
 1
 2
 3
 4
 5
 6
 7
 8
 9
10
11
12
13
14
15
16
17
18
19
20
21
22
23
24
25
|
# 引入BCC库
from bcc import BPF
from time import strftime

# 加载eBPF 程序
b = BPF(src_file="bashreadline.c")

# 挂载uretprobe
b.attach_uretprobe(name="/usr/bin/bash", sym="readline", fn_name="bash_readline")

# 定义性能事件回调(输出时间、UID以及Bash中执行的命令)
def print_event(cpu, data, size):
    event = b["events"].event(data)
    print("%-9s %-6d %s" % (strftime("%H:%M:%S"), event.uid, event.command.decode("utf-8")))

# 打印头
print("%-9s %-6s %s" % ("TIME", "UID", "COMMAND"))

# 绑定性能事件映射和输出函数,并从映射中循环读取数据
b["events"].open_perf_buffer(print_event)
while 1:
    try:
        b.perf_buffer_poll()
    except KeyboardInterrupt:
        exit()
|
用户态和内核态的对比
- 编译型语言应用程序的跟踪与内核的跟踪是类似的,只不过是把跟踪类型从 kprobe 换成了 uprobe 或者 USDT
- 应用程序的符号信息可以存放在 ELF 二进制文件中,也可以以单独文件的形式,放到调试文件中
- 内核的符号信息除了可以存放到内核二进制文件中之外
- 还会以 /proc/kallsyms 和 /sys/kernel/debug 等形式暴露到用户空间
python bcc 支持的 attach 类型
- attach_func
- attach_kfunc
- attach_kprobe
- attach_kretfunc
- attach_kretprobe
- attach_lsm
- attach_perf_event
- attach_perf_event_raw
- attach_raw_socket
- attach_raw_tracepoint
- attach_tracepoint
- attach_uprobe
- attach_uretprobe
- attach_xdp
类型介绍
| Attachment Type |
Description |
Syntax Example |
Use Case |
attach_kprobe |
Attach to kernel function entry |
attach_kprobe(event="do_sys_open", fn_name="trace_open") |
Trace syscall entry points |
attach_kretprobe |
Attach to kernel function return |
attach_kretprobe(event="do_sys_open", fn_name="trace_open_ret") |
Measure syscall latency |
attach_tracepoint |
Attach to stable kernel tracepoint |
attach_tracepoint(tp="sched:sched_process_exec", fn_name="trace_exec") |
Monitor process executions |
attach_raw_tracepoint |
Attach to raw tracepoint (lower overhead) |
attach_raw_tracepoint(tp="sys_enter", fn_name="raw_syscall") |
High-frequency syscall tracing |
attach_uprobe |
Attach to user-space function entry |
attach_uprobe(name="/bin/bash", sym="readline", fn_name="trace_readline") |
Capture shell commands |
attach_uretprobe |
Attach to user-space function return |
attach_uretprobe(name="/bin/bash", sym="readline", fn_name="trace_readline_ret") |
Get command output |
attach_perf_event |
Attach to performance counters |
attach_perf_event(ev_type=PerfType.SOFTWARE, ev_config=PerfSWConfig.CPU_CLOCK, fn_name="profile") |
CPU profiling |
attach_perf_event_raw |
Attach to custom PMU events |
attach_perf_event_raw(ev_config=0x1001, fn_name="cache_events") |
Monitor L1 cache misses |
attach_xdp |
Attach to XDP hook (network) |
attach_xdp(dev="eth0", fn_name="xdp_firewall") |
Packet filtering at driver level |
attach_lsm |
Attach to LSM hook (security) |
attach_lsm(name="file_open", fn_name="audit_open") |
Mandatory access control |
attach_raw_socket |
Attach to raw socket |
attach_raw_socket(iface="eth0", fn_name="sniff_packets") |
Network packet inspection |
attach_kfunc |
Attach to kernel function (BTF-aware) |
attach_kfunc(fn_name="bpf_prog", fn_name="trace_prog") |
Modern kernel tracing (5.5+) |
attach_kretfunc |
Attach to kernel function return (BTF) |
attach_kretfunc(fn_name="bpf_prog", fn_name="trace_prog_ret") |
Safe return value tracing |
attach_func |
Generic attach via function address |
attach_func(addr=0xffffffff81000000, fn_name="trace_kernel") |
Low-level kernel debugging |
解释型语言
解释型语言
- 无法从解释型语言的二进制文件中直接获取应用程序的调试信息
- 只能获得解释器本身的符号信息
- 对于这类语言开发的应用程序,通常需要跟踪解释器内的函数
- 再从其参数中获取应用程序的运行细节
Instrumenting CPython with DTrace and SystemTap
查找
1
|
bpftrace -l '*:/usr/bin/python3:*'
|
python 跟踪点
- 为其开启 USDT 跟踪点(编译选项为 –with-dtrace)之后
- Python3 二进制文件中就会包含一系列的 USDT 跟踪点
function 跟踪
1
2
3
|
// 三个参数分别是文件名、函数名和行号
function__entry(str filename, str funcname, int lineno)
function__return(str filename, str funcname, int lineno)
|
python function__entry
跟踪
1
2
3
|
sudo bpftrace -e \
'usdt:/usr/bin/python3:function__entry { printf("%s:%d %s\n",
str(arg0), arg2, str(arg1))}'
|
追踪 字典
1
2
3
4
5
|
sudo bpftrace -e '
uprobe:/usr/bin/python3:PyDict_New {
    printf("Process %s (PID %d) created a new dictionary\n", comm, pid);
}
'
|
安装依赖
1
|
apt-get install python3-dbg
|
跟踪 dist
 1
 2
 3
 4
 5
 6
 7
 8
 9
10
11
12
13
14
|
sudo bpftrace -e '
uprobe:/usr/bin/python3:PyDict_New {
    @calls[comm] = count();  // Count calls per process
}

uretprobe:/usr/bin/python3:PyDict_New {
    printf("PID %d created dict at 0x%p\n", pid, retval);
    @dicts = hist(retval);   // Track address distribution
}

END {
    printf("\n=== Dictionary Creation Summary ===\n");
    print(@calls);
}'
|
Dictionary Objects C API
bcc 程序
 1
 2
 3
 4
 5
 6
 7
 8
 9
10
11
12
13
14
15
16
17
18
19
20
21
22
23
24
|
// 头文件引用和数据结构定义...

int print_functions(struct pt_regs *ctx)
{
    uint64_t argptr;
    struct data_t data = { };

  // 参数1是文件名
    bpf_usdt_readarg(1, ctx, &argptr);
    bpf_probe_read_user(&data.filename, sizeof(data.filename),
                (void *)argptr);

  // 参数2是函数名
    bpf_usdt_readarg(2, ctx, &argptr);
    bpf_probe_read_user(&data.funcname, sizeof(data.funcname),
                (void *)argptr);

  // 参数3是行号
  bpf_usdt_readarg(3, ctx, &data.lineno);

    // 最后提交性能事件
    events.perf_submit(ctx, &data, sizeof(data));
    return 0;
};
|
python
1
2
3
4
5
6
7
|
from bcc import BPF, USDT

u = USDT(pid=pid)
u.enable_probe(probe="function__entry", fn_name="print_functions")
b = BPF(src_file="<ebpf-program>.c", usdt_contexts=[u])

# 其他处理逻辑
|
即时编译型语言
以 java 24 为例:
查找
 1
 2
 3
 4
 5
 6
 7
 8
 9
10
11
12
|
bpftrace -l '*:/data/soft/jdk-24.0.1/bin/java:*'
uprobe:/data/soft/jdk-24.0.1/bin/java:__do_global_dtors_aux
uprobe:/data/soft/jdk-24.0.1/bin/java:__libc_csu_fini
uprobe:/data/soft/jdk-24.0.1/bin/java:__libc_csu_init
uprobe:/data/soft/jdk-24.0.1/bin/java:_fini
uprobe:/data/soft/jdk-24.0.1/bin/java:_init
uprobe:/data/soft/jdk-24.0.1/bin/java:_start
uprobe:/data/soft/jdk-24.0.1/bin/java:call_gmon_start
uprobe:/data/soft/jdk-24.0.1/bin/java:deregister_tm_clones
uprobe:/data/soft/jdk-24.0.1/bin/java:frame_dummy
uprobe:/data/soft/jdk-24.0.1/bin/java:main
uprobe:/data/soft/jdk-24.0.1/bin/java:register_tm_clones
|
Why Java Tracing is Difficult
| Challenge |
Impact |
| JIT Compilation |
Java methods are compiled to native code at runtime → No static symbols |
| Dynamic Class Loading |
Classes/methods appear/disappear during execution |
| JVM Complexity |
Multiple abstraction layers (bytecode → JIT → native) |
| Symbol Scarcity |
Only JVM bootstrap symbols visible (as in your output) |
因为 JVM,.net, javascritp 等是运行时编译的
本地存储的是 JVM 字节码,是特定语言的 字节码,而 JIT 运行的时候会动态编译成 native code
所以编译信息都是在内存中,很难跟踪
bpftrace
 1
 2
 3
 4
 5
 6
 7
 8
 9
10
|
bpftrace -e '
uprobe:/data/soft/jdk-24.0.1/bin/java:main {
    printf("Java launched with %d arguments:\n", arg0);
    $argv = arg1;

    // Read first 3 arguments (adjust as needed)
    printf("argv[0] = %s\n", str(*(uint64*)($argv + 0)));
    printf("argv[1] = %s\n", str(*(uint64*)($argv + 8)));
    printf("argv[2] = %s\n", str(*(uint64*)($argv + 16)));
}'
|
打印结果
1
2
3
4
5
|
Attaching 1 probe...
Java launched with 3 arguments:
argv[0] = java
argv[1] = -agentpath:./libperfmap.so
argv[2] = MyApp
|
bcc 用户态跟踪库
jvm 相关的 so
1
2
3
4
5
6
7
8
|
# 很多 jvm 相关的跟踪点
bpftrace -l '*:/data/soft/jdk-24.0.1/lib/libjava.so:*'

# nio 相关的
bpftrace -l '*:/data/soft/jdk-24.0.1/lib/libnio.so:*'

# 包含了 39801 个跟踪点
bpftrace -l '*:/data/soft/jdk-24.0.1/lib/*.so:*' | wc -l
|
参考