查找内核
内核函数是一个非稳定 API,在新版本中可能会发生变化
挂载的内核函数在/proc/kallsyms
1
2
3
4
|
cat /proc/kallsyms | wc -l

# 结果
231892
|
系统调试文件DebugFS
- 提供内核调试所需的基本信息
- 如内核符号列表、跟踪点、函数跟踪(ftrace)状态以及参数格式等
查询 execve 系统调用的参数格式
 1
 2
 3
 4
 5
 6
 7
 8
 9
10
11
12
13
14
15
16
|
cat /sys/kernel/debug/tracing/events/syscalls/sys_enter_execve/format
name: sys_enter_execve
ID: 817
format:
        field:unsigned short common_type;       offset:0;       size:2; signed:0;
        field:unsigned char common_flags;       offset:2;       size:1; signed:0;
        field:unsigned char common_preempt_count;       offset:3;       size:1; signed:0;
        field:int common_pid;   offset:4;       size:4; signed:1;

        field:int __syscall_nr; offset:8;       size:4; signed:1;
        field:const char * filename;    offset:16;      size:8; signed:0;
        field:const char *const * argv; offset:24;      size:8; signed:0;
        field:const char *const * envp; offset:32;      size:8; signed:0;

print fmt: "filename: 0x%08lx, argv: 0x%08lx, envp: 0x%08lx",
 ((unsigned long)(REC->filename)), ((unsigned long)(REC->argv)), ((unsigned long)(REC->envp))
|
eBPF 程序的执行也依赖于调试文件系统
挂载调试文件
1
|
sudo mount -t debugfs debugfs /sys/kernel/debug
|
也可以通过 perf 来查询,不过返回的结果非常非常多
更好的查找方式: bpftrace
用perf记录
1
2
3
4
5
6
7
|
# 查看
perf list 'syscalls:*'

sudo perf record -e 'syscalls:sys_enter_mkdir' -a -g -- sleep 30

# 分析,在 3.1 的老内核上也可以使用
perf script -i perf.data
|
结果
 1
 2
 3
 4
 5
 6
 7
 8
 9
10
11
12
13
14
15
16
17
18
19
20
21
22
23
24
25
26
27
|
systemd-journal   517 [001] 1215680.725699: syscalls:sys_enter_mkdir: pathname: 0x7ffd4bf86cc0,
mode: 0x000001ed
            7fc6e75ab6a7 __GI___mkdir+0x7 (/usr/lib64/libc-2.17.so)
            563c1c67754f [unknown] (/usr/lib/systemd/systemd-journald)
            563c1c677a3f [unknown] (/usr/lib/systemd/systemd-journald)

systemd-journal   517 [001] 1215680.725814: syscalls:sys_enter_mkdir: pathname: 0x7ffd4bf86ad0,
mode: 0x000001ed
            7fc6e75ab6a7 __GI___mkdir+0x7 (/usr/lib64/libc-2.17.so)
            563c1c676c0e [unknown] (/usr/lib/systemd/systemd-journald)
systemd-journal   517 [001] 1215680.725699: syscalls:sys_enter_mkdir: pathname: 0x7ffd4bf86cc0,
mode: 0x000001ed
            7fc6e75ab6a7 __GI___mkdir+0x7 (/usr/lib64/libc-2.17.so)
            563c1c67754f [unknown] (/usr/lib/systemd/systemd-journald)
            563c1c677a3f [unknown] (/usr/lib/systemd/systemd-journald)

systemd-journal   517 [001] 1215680.725814: syscalls:sys_enter_mkdir: pathname: 0x7ffd4bf86ad0,
mode: 0x000001ed
            7fc6e75ab6a7 __GI___mkdir+0x7 (/usr/lib64/libc-2.17.so)
            563c1c676c0e [unknown] (/usr/lib/systemd/systemd-journald)
            563c1c67754f [unknown] (/usr/lib/systemd/systemd-journald)
            563c1c677a3f [unknown] (/usr/lib/systemd/systemd-journald)

systemd     1 [001] 1215680.863208: syscalls:sys_enter_mkdir: pathname: 0x558b8a098240,
mode: 0x000001ed
            7f38463106a7 __GI___mkdir+0x7 (/usr/lib64/libc-2.17.so)
        c30173fffff0013d [unknown] ([unknown])
|
生成火焰图
1
2
3
4
5
6
|
# 1. Export stacks
perf script -i perf.data > out.stacks

# 2. Generate flame graph
git clone https://github.com/brendangregg/FlameGraph
FlameGraph/stackcollapse-perf.pl < out.stacks | FlameGraph/flamegraph.pl > syscalls.svg
|
perf 调用(用户和内核的交互)
sequenceDiagram
    participant U as User
    participant P as Perf
    participant K as Kernel
    participant D as Debugger

    U->>P: record -e event
    P->>K: Raw event data
    K-->>P: Numbers/addresses
    P->>D: Manual decoding
    D-->>U: Resolved data
对比 bpf 调用(用户和内核的交互)
sequenceDiagram
    participant U as User
    participant B as eBPF
    participant K as Kernel

    U->>B: Program with custom format
    B->>K: Real-time processing
    K-->>B: Structured data
    B-->>U: Ready-to-read output
perf 的问题
- 基于 /sys/kernel/debug/tracing/events,不在这个内核暴露的目录中,就无法跟踪了
- 返回的内容是固定格式的,比如 进程名、地址之类的,而 bpf 是自定义的格式
- 用户 <–> 内核有频繁交互,性能比如 BPF
- 像文件系统、网络、调度,perf 就跟踪不了
bpftrace
bpftrace 是构建在 bcc 之上的,简化了很多
工作原理如下:
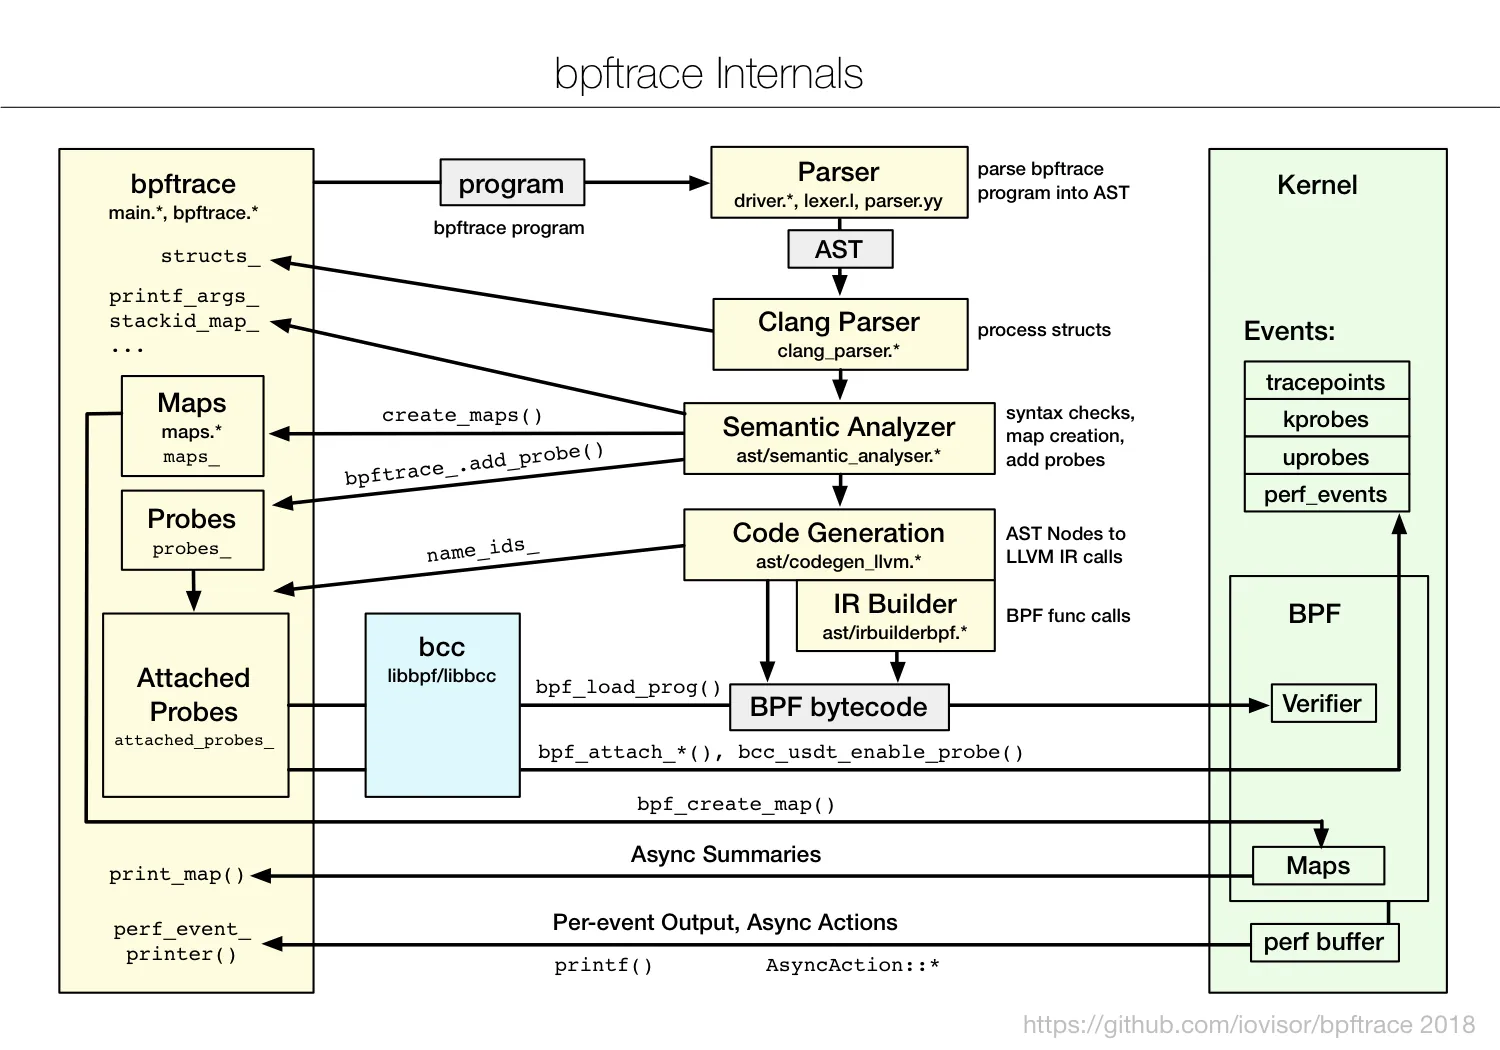
bpftrace Internals
1
2
3
4
5
6
7
8
|
# 查询所有内核插桩和跟踪点
sudo bpftrace -l

# 使用通配符查询所有的系统调用跟踪点
sudo bpftrace -l 'tracepoint:syscalls:*'

# 使用通配符查询所有名字包含"execve"的跟踪点
sudo bpftrace -l '*execve*'
|
主要包括
- 内核插桩(kprobe)
- 跟踪点(tracepoint)
kprobe 通过 int3 中断,保存当前的系统调用信息,转而执行用户的函数,可以执行所有内核
跟踪点(tracepoint),open.c 内核函数大致如下
1
2
3
4
5
6
|
SYSCALL_DEFINE3(open, const char __user *, filename, int, flags, umode_t, mode)
{
    // ...
    trace_sys_enter_open(filename, flags, mode);  // <-- TRACEPOINT STUB CALL
    return do_sys_open(AT_FDCWD, filename, flags, mode);
}
|
如果 trace_sys_enter_open 被注册,则会转而执行自定义的函数
如果没有注册,则执行 nop 指令不占用时间
查询 execve 的参数
1
2
3
4
5
6
|
sudo bpftrace -lv tracepoint:syscalls:sys_enter_execve
tracepoint:syscalls:sys_enter_execve
    int __syscall_nr
    const char * filename
    const char *const * argv
    const char *const * envp
|
| Feature/Category |
bpftrace |
BCC |
libbpf |
| Primary Use Case |
Quick system troubleshooting and diagnostics |
Complex eBPF program development |
Production deployment and distribution |
| Development Style |
Single-line scripts |
Full C/Python programs with helpers |
Complete BPF application development |
| Execution Pattern |
Interactive one-liners |
Compiled at runtime on target machine |
Compile-once, run-anywhere |
| Complexity Level |
Simple programs only |
Supports complex implementations |
Supports complex implementations |
| Dependencies |
Requires BCC and LLVM on target |
Requires LLVM and kernel headers on target |
No LLVM/kernel headers on target |
| Kernel Requirements |
Any kernel (BPF support only) |
Any kernel (BPF support) |
BTF required (CONFIG_DEBUG_INFO_BTF=y) |
| Deployment |
Tool must run on target |
Tool+compiler must run on target |
Single binary distribution |
| Portability |
Manual re-run on different kernels |
Recompiles automatically on target |
Works across distros (kernels ≥5.8) |
| Example Distros |
All Linux with kernel 4.1+ |
All Linux with kernel 4.1+ |
RHEL 8.2+, Ubuntu 20.10+, Fedora 34+ |
| Strengths |
Ad-hoc debugging, rapid prototyping |
Comprehensive tracing tools, rich libraries |
Production stability, minimal overhead |
| Limitations |
Limited program complexity |
Heavy runtime dependencies, memory overhead |
Requires modern kernel (BTF support) |
| Performance Impact |
Medium (runtime compilation) |
High (JIT compilation at runtime) |
Low (pre-compiled) |
| Main Users |
Sysadmins, quick diagnostics |
Developers, complex tracing |
Production systems, embedded environments |
命令
1
2
3
4
5
6
7
8
9
|
sudo bpftrace -e '
tracepoint:syscalls:sys_enter_execve,
tracepoint:syscalls:sys_enter_execveat
{
   printf("%-6d %-8s", pid, comm);
   join(args->argv);
}'
Attaching 2 probes...
4760   bash    ls --color=auto
|
bpf 内置的
打印出 AST 和 LLVM 字节码
1
2
3
|
bpftrace -d -e 'tracepoint:syscalls:sys_enter_execve {
  cat("/proc/%d/maps", pid);
}'
|
bcc
c 代码
 1
 2
 3
 4
 5
 6
 7
 8
 9
10
11
12
13
14
15
16
17
18
19
20
21
22
23
24
25
26
27
28
29
30
31
32
33
34
35
36
37
38
39
40
41
42
43
44
45
46
47
48
49
50
51
52
53
54
55
56
57
58
59
60
61
62
63
64
65
66
67
68
69
70
71
72
73
74
75
76
77
78
79
80
81
82
83
84
85
86
87
88
89
90
91
92
93
94
95
|
#include <linux/sched.h>
#include <linux/fs.h>

// consts for arguments (ensure below stack size limit 512)
#define ARGSIZE 64
#define TOTAL_MAX_ARGS 5
#define FULL_MAX_ARGS_ARR (TOTAL_MAX_ARGS * ARGSIZE)
#define LAST_ARG (FULL_MAX_ARGS_ARR - ARGSIZE)

// perf event map (sharing data to userspace) and hash map (sharing data between tracepoints)
struct data_t {
        u32 pid;
        char comm[TASK_COMM_LEN];
        int retval;
        unsigned int args_size;
        char argv[FULL_MAX_ARGS_ARR];
};

// 这句是创建一个 ring_buffer,名字叫 events,也可以改成 haha_events
// 后面python 代码获取的时候就要读取 haha_events
// In kernel-space, use events.perf_submit(ctx, &data, size) to send data
// In userspace (Python/C), access it via b["events"] and attach a callback with open_perf_buffer()
BPF_PERF_OUTPUT(events);

// 相当于定义了一个 hash-map,名字叫:tasks, key 是 u32类型的,value 就是上面定义的:data_t
BPF_HASH(tasks, u32, struct data_t);

// helper function to read string from userspace.
static int __bpf_read_arg_str(struct data_t *data, const char *ptr)
{
        if (data->args_size > LAST_ARG) {
                return -1;
        }

        int ret = bpf_probe_read_user_str(&data->argv[data->args_size], ARGSIZE,
                                          (void *)ptr);
        if (ret > ARGSIZE || ret < 0) {
                return -1;
        }
        // increase the args size. the first tailing '\0' is not counted and hence it
        // would be overwritten by the next call.
        data->args_size += (ret - 1);

        return 0;
}

// sys_enter_execve tracepoint.
TRACEPOINT_PROBE(syscalls, sys_enter_execve)
{
        // variables definitions
        unsigned int ret = 0;
        const char **argv = (const char **)(args->argv);

        // get the pid and comm
        struct data_t data = { };
        u32 pid = bpf_get_current_pid_tgid();
        data.pid = pid;
        bpf_get_current_comm(&data.comm, sizeof(data.comm));

        // get the binary name (first argment)
        if (__bpf_read_arg_str(&data, (const char *)argv[0]) < 0) {
                goto out;
        }
        // get other arguments (skip first arg because it has already been read)
#pragma unroll
        for (int i = 1; i < TOTAL_MAX_ARGS; i++) {
                if (__bpf_read_arg_str(&data, (const char *)argv[i]) < 0) {
                        goto out;
                }
        }

 out:
        // store the data in hash map
        tasks.update(&pid, &data);
        return 0;
}

// sys_exit_execve tracepoint
TRACEPOINT_PROBE(syscalls, sys_exit_execve)
{
        // query the data from hash map
        u32 pid = bpf_get_current_pid_tgid();
        struct data_t *data = tasks.lookup(&pid);

        // submit perf events after getting the retval
        if (data != NULL) {
                data->retval = args->ret;
                events.perf_submit(args, data, sizeof(struct data_t));

                // clean up the hash map
                tasks.delete(&pid);
        }

        return 0;
}
|
上面 c 代码的调用关系如下:
sequenceDiagram
    participant Enter as sys_enter_execve
    participant Tasks as tasks
    participant Exit as sys_exit_execve
    participant Events as events

    Enter->>Tasks: Store PID, comm, args
    Exit->>Tasks: Retrieve data by PID
    Exit->>Events: Submit PID, comm, args, retval
    Exit->>Tasks: Delete entry
python 代码
 1
 2
 3
 4
 5
 6
 7
 8
 9
10
11
12
13
14
15
16
17
18
19
20
21
22
23
24
25
26
27
28
29
|
from bcc import BPF
from bcc.utils import printb
b = BPF(src_file="execsnoop.c")
print("%-6s %-16s %-3s %s" % ("PID", "COMM", "RET", "ARGS"))
def print_event(cpu, data, size):
# References the BPF_PERF_OUTPUT(events) map declared in eBPF C code.
# This is a PerfEventArray for streaming data from kernel to userspace
event = b["events"].event(data)
printb(b"%-6d %-16s %-3d %-16s" % (event.pid, event.comm, event.retval, event.argv))
# Action: Initializes the perf buffer named events (defined
# in the eBPF C code) and links it to the print_event callback
# Kernel ↔ Userspace: The eBPF program submits events via perf_submit(),
# which are asynchronously handled in userspace by print_event.
b["events"].open_perf_buffer(print_event)
while 1:
try:
# Blocking Poll: perf_buffer_poll() waits indefinitely for new events from the kernel
# When data arrives in the "events" buffer,
# BCC automatically calls print_event and populates its arguments with:
# The CPU ID where the eBPF program submitted the event.
# The raw event data (as a byte buffer).
# The size of that buffer.
b.perf_buffer_poll()
except KeyboardInterrupt:
exit()
|
python 代码 和 c 代码交互的过程:
sequenceDiagram
    participant K as Kernel
    participant B as eBPF
    participant P as PerfBuffer
    participant Py as Python
    participant O as Output

    K-->>B: Trigger on sys_execve()
    B-->>P: perf_submit(event_data)
    P-->>Py: Invoke print_event()
    Py-->>O: Print formatted event
参考例子
libbpf
使用 libbpf 开发 eBPF 程序就可以通过以下四个步骤完成
- 使用 bpftool 生成内核数据结构定义头文件
- 开发 eBPF 程序部分,也就是内核态的代码,eBPF 程序的源码文件一般命名为 <程序名>.bpf.c
- 编译 eBPF 程序为字节码,再用 bpftool 生成 脚手架头文件(Skeleton Header);这个头文件包含了 eBPF 字节码以及相关的加载、挂载和卸载函数,可在用户态程序中直接调用
- 开发用户态代码,并完整最终编译,生成可执行文件
生成内核头文件
1
|
sudo bpftool btf dump file /sys/kernel/btf/vmlinux format c > vmlinux.h
|
execsnoop.h 头文件
 1
 2
 3
 4
 5
 6
 7
 8
 9
10
11
12
13
14
15
16
17
18
19
20
21
|
#ifndef __HELLO_H
#define __HELLO_H

#define ARGSIZE  128
#define TASK_COMM_LEN 16
#define TOTAL_MAX_ARGS 60
#define FULL_MAX_ARGS_ARR (TOTAL_MAX_ARGS * ARGSIZE)
#define BASE_EVENT_SIZE (size_t)(&((struct event*)0)->args)
#define EVENT_SIZE(e) (BASE_EVENT_SIZE + e->args_size)
#define LAST_ARG (FULL_MAX_ARGS_ARR - ARGSIZE)

struct event {
        char comm[TASK_COMM_LEN];
        pid_t pid;
        int retval;
        int args_count;
        unsigned int args_size;
        char args[FULL_MAX_ARGS_ARR];
};

#endif
|
execsnoop.bpf.c 代码
  1
  2
  3
  4
  5
  6
  7
  8
  9
 10
 11
 12
 13
 14
 15
 16
 17
 18
 19
 20
 21
 22
 23
 24
 25
 26
 27
 28
 29
 30
 31
 32
 33
 34
 35
 36
 37
 38
 39
 40
 41
 42
 43
 44
 45
 46
 47
 48
 49
 50
 51
 52
 53
 54
 55
 56
 57
 58
 59
 60
 61
 62
 63
 64
 65
 66
 67
 68
 69
 70
 71
 72
 73
 74
 75
 76
 77
 78
 79
 80
 81
 82
 83
 84
 85
 86
 87
 88
 89
 90
 91
 92
 93
 94
 95
 96
 97
 98
 99
100
101
102
103
104
105
106
107
108
109
110
111
112
113
114
115
116
117
118
119
120
121
122
123
124
125
126
127
128
129
130
131
132
133
134
135
|
#include "vmlinux.h"
#include <bpf/bpf_helpers.h>
#include "execsnoop.h"

static const struct event empty_event = { };

// define hash map and perf event map
// 下面是分别定义:
// Map type attribute、size attribute、type attribute、Value type attribute
struct {
        __uint(type, BPF_MAP_TYPE_HASH);
        __uint(max_entries, 10240);
        __type(key, pid_t);
        __type(value, struct event);
} execs SEC(".maps"); // Map variable name

// Old approach (deprecated)
/*
struct bpf_map_def SEC("maps") execs = {
    .type = BPF_MAP_TYPE_HASH,
    .key_size = sizeof(pid_t),
    .value_size = sizeof(struct event),
    .max_entries = 10240,
};
*/

struct {
        __uint(type, BPF_MAP_TYPE_PERF_EVENT_ARRAY);
        __uint(key_size, sizeof(u32));
        __uint(value_size, sizeof(u32));
}
events SEC(".maps");

// tracepoint for sys_enter_execve.
SEC("tracepoint/syscalls/sys_enter_execve")
int tracepoint__syscalls__sys_enter_execve(struct trace_event_raw_sys_enter
                                           *ctx)
{
        struct event *event;
        const char **args = (const char **)(ctx->args[1]);
        const char *argp;

        // get the PID
        u64 id = bpf_get_current_pid_tgid();
        pid_t pid = (pid_t) id;

        // update the exec metadata to execs map
        if (bpf_map_update_elem(&execs, &pid, &empty_event, BPF_NOEXIST)) {
                return 0;
        }
        event = bpf_map_lookup_elem(&execs, &pid);
        if (!event) {
                return 0;
        }
        // update event metadata
        event->pid = pid;
        event->args_count = 0;
        event->args_size = 0;

        // query the first parameter
        unsigned int ret = bpf_probe_read_user_str(event->args, ARGSIZE,
                                                   (const char *)ctx->args[0]);
        if (ret <= ARGSIZE) {
                event->args_size += ret;
        } else {
                /* write an empty string */
                event->args[0] = '\0';
                event->args_size++;
        }

        // query the extra parameters
        event->args_count++;
#pragma unroll
        for (int i = 1; i < TOTAL_MAX_ARGS; i++) {
                bpf_probe_read_user(&argp, sizeof(argp), &args[i]);
                if (!argp)
                        return 0;

                if (event->args_size > LAST_ARG)
                        return 0;

                ret =
                    bpf_probe_read_user_str(&event->args[event->args_size],
                                            ARGSIZE, argp);
                if (ret > ARGSIZE)
                        return 0;

                event->args_count++;
                event->args_size += ret;
        }

        /* try to read one more argument to check if there is one */
        bpf_probe_read_user(&argp, sizeof(argp), &args[TOTAL_MAX_ARGS]);
        if (!argp)
                return 0;

        /* pointer to max_args+1 isn't null, assume we have more arguments */
        event->args_count++;

        return 0;
}

// tracepoint for sys_exit_execve.
SEC("tracepoint/syscalls/sys_exit_execve")
int tracepoint__syscalls__sys_exit_execve(struct trace_event_raw_sys_exit *ctx)
{
        u64 id;
        pid_t pid;
        int ret;
        struct event *event;

        // get the exec metadata from execs map
        id = bpf_get_current_pid_tgid();
        pid = (pid_t) id;
        event = bpf_map_lookup_elem(&execs, &pid);
        if (!event)
                return 0;

        // update event retval
        ret = ctx->ret;
        event->retval = ret;
        bpf_get_current_comm(&event->comm, sizeof(event->comm));

        // submit to perf event
        size_t len = EVENT_SIZE(event);
        if (len <= sizeof(*event))
                bpf_perf_event_output(ctx, &events, BPF_F_CURRENT_CPU, event,
                                      len);

        // cleanup exec from hash map
        bpf_map_delete_elem(&execs, &pid);
        return 0;
}

char LICENSE[] SEC("license") = "Dual BSD/GPL";
|
程序,编译器,ELF文件格式,内核的交互过程
sequenceDiagram
    participant P as Program
    participant C as Compiler
    participant E as ELF
    participant L as Libbpf-Loader
    participant K as Kernel
    participant U as User-Space

    P->>C: Parse map definitions
    C->>E: Write .maps sections + BTF
    L->>K: Create maps using BTF metadata
    K-->>L: Return map FDs
    L->>U: Expose maps via skeleton
编译
1
2
|
clang -g -O2 -target bpf -D__TARGET_ARCH_x86_64 -I/usr/include/x86_64-linux-gnu -I. \
-c execsnoop.bpf.c -o execsnoop.bpf.o
|
生成 骨架文件
1
|
bpftool gen skeleton execsnoop.bpf.o > execsnoop.skel.h
|
用户态代码 execsnoop.c
  1
  2
  3
  4
  5
  6
  7
  8
  9
 10
 11
 12
 13
 14
 15
 16
 17
 18
 19
 20
 21
 22
 23
 24
 25
 26
 27
 28
 29
 30
 31
 32
 33
 34
 35
 36
 37
 38
 39
 40
 41
 42
 43
 44
 45
 46
 47
 48
 49
 50
 51
 52
 53
 54
 55
 56
 57
 58
 59
 60
 61
 62
 63
 64
 65
 66
 67
 68
 69
 70
 71
 72
 73
 74
 75
 76
 77
 78
 79
 80
 81
 82
 83
 84
 85
 86
 87
 88
 89
 90
 91
 92
 93
 94
 95
 96
 97
 98
 99
100
101
102
103
104
105
106
107
108
109
110
111
112
113
114
115
116
117
118
119
120
121
|
#include <stdio.h>
#include <unistd.h>
#include <stdlib.h>
#include <sys/resource.h>
#include <bpf/libbpf.h>
#include <time.h>
#include "execsnoop.h"
#include "execsnoop.skel.h"

// Handler for libbpf errors and debug info callback.
static int libbpf_print_fn(enum libbpf_print_level level, const char *format,
                           va_list args)
{
#ifdef DEBUGBPF
        return vfprintf(stderr, format, args);
#else
        return 0;
#endif
}

// Handler for lost events.
void handle_lost_events(void *ctx, int cpu, __u64 lost_cnt)
{
        fprintf(stderr, "Lost %llu events on CPU #%d!\n", lost_cnt, cpu);
}

// Heandler for print arguments (args are separated by '\0').
static void print_args(const struct event *e)
{
        int args_counter = 0;

        for (int i = 0; i < e->args_size && args_counter < e->args_count; i++) {
                char c = e->args[i];
                if (c == '\0') {
                        args_counter++;
                        putchar(' ');
                } else {
                        putchar(c);
                }
        }
        if (e->args_count > TOTAL_MAX_ARGS) {
                fputs(" ...", stdout);
        }
}

// Handler for each perf event.
void handle_event(void *ctx, int cpu, void *data, __u32 data_sz)
{
        const struct event *e = data;
        printf("%-16s %-6d %3d ", e->comm, e->pid, e->retval);
        print_args(e);
        putchar('\n');
}

// Bump RLIMIT_MEMLOCK to allow BPF sub-system to do anything it needs.
static void bump_memlock_rlimit(void)
{
        struct rlimit rlim_new = {
                .rlim_cur = RLIM_INFINITY,
                .rlim_max = RLIM_INFINITY,
        };

        if (setrlimit(RLIMIT_MEMLOCK, &rlim_new)) {
                fprintf(stderr, "Failed to increase RLIMIT_MEMLOCK limit!\n");
                exit(1);
        }
}

int main(int argc, char **argv)
{
        struct execsnoop_bpf *skel;
        struct perf_buffer *pb = NULL;
        int err;

        /* Set up libbpf errors and debug info callback */
        libbpf_set_print(libbpf_print_fn);

        /* Bump RLIMIT_MEMLOCK to allow BPF sub-system to do anything */
        bump_memlock_rlimit();

        /* Open BPF application (generated by bpftool gen skeleton) */
        skel = execsnoop_bpf__open();
        if (!skel) {
                fprintf(stderr, "Failed to open BPF skeleton\n");
                return 1;
        }

        /* Load & verify BPF programs (generated by bpftool gen skeleton) */
        err = execsnoop_bpf__load(skel);
        if (err) {
                fprintf(stderr, "Failed to load and verify BPF skeleton\n");
                goto cleanup;
        }

        /* Attach tracepoint handler (generated by bpftool gen skeleton) */
        err = execsnoop_bpf__attach(skel);
        if (err) {
                fprintf(stderr, "Failed to attach BPF skeleton\n");
                goto cleanup;
        }

        pb = perf_buffer__new(bpf_map__fd(skel->maps.events), 64, handle_event,
                              handle_lost_events, NULL, NULL);
        err = libbpf_get_error(pb);
        if (err) {
                pb = NULL;
                fprintf(stderr, "failed to open perf buffer: %d\n", err);
                goto cleanup;
        }

        printf("%-16s %-6s %3s %s\n", "COMM", "PID", "RET", "ARGS");

        /* Main polling loop */
        while ((err = perf_buffer__poll(pb, 100)) >= 0) ;
        printf("Error polling perf buffer: %d\n", err);

 cleanup:
        perf_buffer__free(pb);
        execsnoop_bpf__destroy(skel);
        return err != 0;
}
|
用户态、内核态的交互过程
sequenceDiagram
    participant K as Kernel BPF
    participant P as Perf Buffer
    participant H as handle_event
    participant A as print_args
    participant O as stdout

    K->>P: Submit event
    P->>H: Forward event
    H->>A: Format arguments
    A->>O: Print reconstructed command
程序释放的过程
sequenceDiagram
    participant U as User-Space
    participant K as Kernel
    participant M as Memory
    participant B as BPF
    participant T as Tracepoints

    U->>K: perf_buffer__free()
    K->>M: Release ring buffer pages
    K->>B: Detach perfbuf from map
    U->>K: execsnoop_bpf__destroy()
    K->>B: bpf_map_free(execs)
    K->>B: bpf_map_free(events)
    K->>B: bpf_prog_put(tracepoint)
    B->>T: Unregister handlers
编译用户态代码
1
|
clang -g -O2 -Wall -I . -c execsnoop.c -o execsnoop.o
|
生成最终可执行文件
1
2
|
sudo apt install libzstd-dev
clang -Wall -O2 -g execsnoop.o -static -lbpf -lelf -lz -o execsnoop
|
执行这个二进制程序
1
2
3
4
5
6
|
./execsnoop
COMM             PID    RET ARGS
ls               3292     0 /usr/bin/ls --color=auto
ls               3293     0 /usr/bin/ls --color=auto
sleep            3295     0 /usr/bin/sleep 1
gcc              3296     0 /usr/bin/gcc --version
|
参考